Hello folks!
Today, I will share another cool project I had been working on during my semester. It's called "CITATION RECOMMENDATION IN MICROSOFT ACADEMIC GRAPH".
Citations have always been the best way to know popularity of a paper and it's author(s). The more the number of citations, the more popular and widely accepted the paper is. Google scholar does a great job of keeping authors and their followers keeping abreast with the status of paper/author citations. So, what is a citation? In it's most rudimentary form, citation is a reference to a published paper (and author subsequently) in a paper being ready to be published. It's done in order to give attributions to others work which have been used while writing the current paper. It's a great practice, but not always an easy one. For example, if you are writing a paper on Neural Networks, their is so much information out there that you will be overwhelmed if you had to decide what all papers you should cite (since you would be going through a lot of them). To make this task easier, comes "CITATION RECOMMENDATION". The idea is to provide papers that an author should cite in his current work. Simple! Right? Well...not so much. There's just too many papers out there to be recommended that only a good algorithm will be able to give the best answers with minimum information. We tried to build something like that with our tools and knowledge of data science & big data.
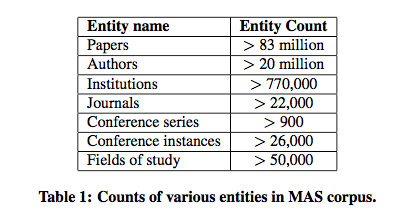
To build this recommendation system, we used a dataset provided by Microsoft Academic Graph initiative. Microsoft researchers have done a great job explaining how and why the data was curated in their paper. The data (99GB uncompressed) exceeds 83 Million papers by 20 Million authors from all across the globe (literally).
Now, even though the figures sound gargantuan, they really aren't in Big Data world. But, it's good enough to get us started. Anyways, I won't be able to use all the data on my personal machine (a powerful yet restricted Macbook Air). So, let's go ahead and start our ANALYSIS!
As the most revered data scientist say, 'know the data', the obvious first step (assuming it's clean data) would be to do 'Exploratory Data Analysis or EDA'. Sounds cool. Right? It indeed is, because this is where we see all the surprises that the data gives us- weird/missing values, strange patterns, seemingly impossible correlations and so on.
Exploratory Data Analysis
EDA on our data gives us some really good results.
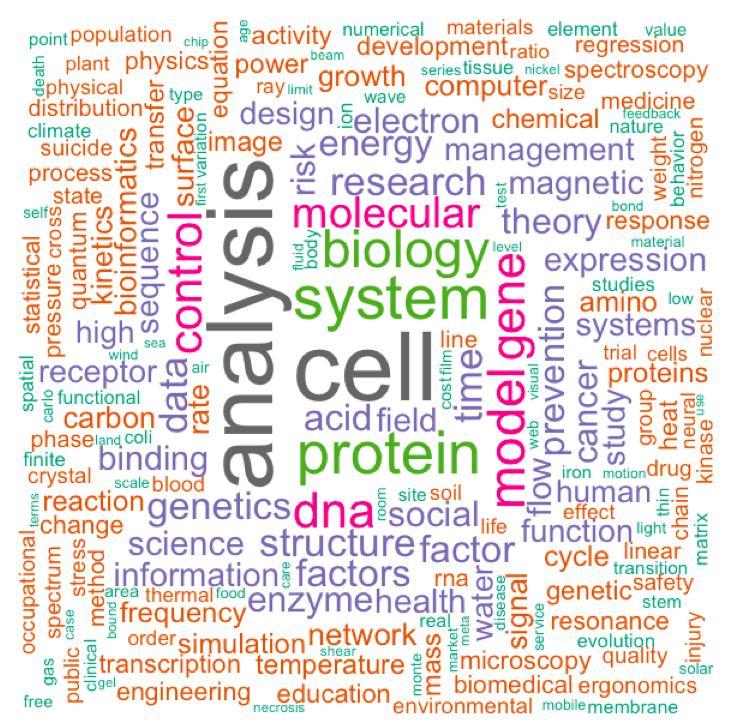
The above word cloud represents the keywords that have occurred most frequently in the dataset we had. For example, we can infer that there have been lots of papers referring to biological keywords (cells, analysis, protein, etc), while environmental sciences (water, environment,climate, etc) don't publish many papers. Thus, this gives us a pretty good idea of what we are dealing with (lots n lots of biology papers).
Next, we see the effect of year of publishing on the number of citations.
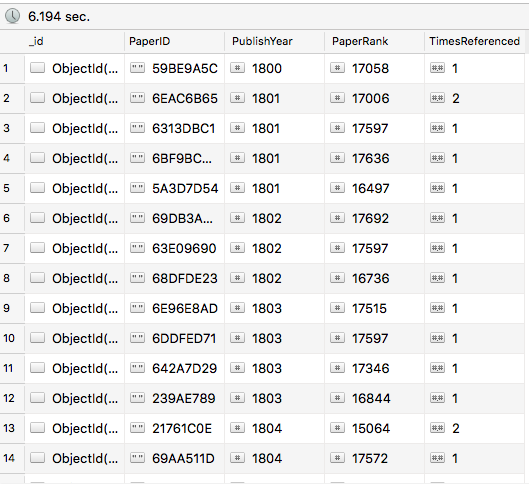 Papers in 1800s
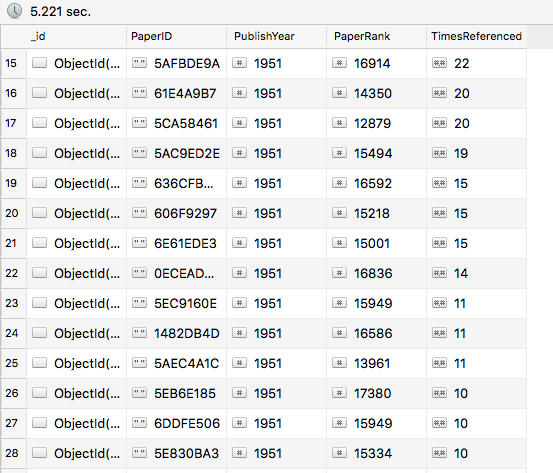 Papers in 1950s
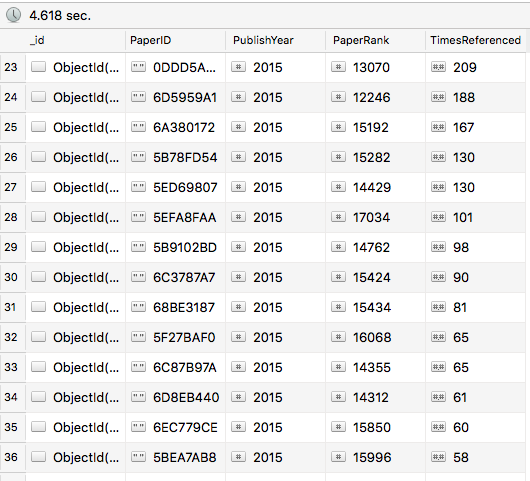 Papers in 2015s
As we can see above, the papers from 1800s (yes they wrote back then as well) got extremely low citations, the one's in 1950s got moderate number of citations, but the most recent ones have already got tons of citations to their name. So, yes, "Age is not just a number here", year of publishing does have an impact on citation numbers.
In our data, we have something given as rank of paper (more details in Microsoft's paper). Let's see if it affects citation. It obviously should if you ask me. So lets see from analysis.
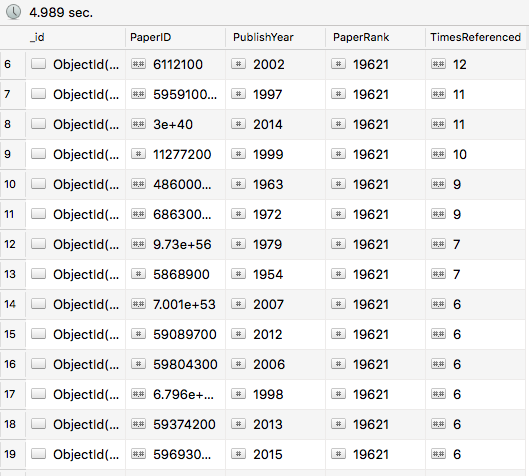 Low Ranked Papers
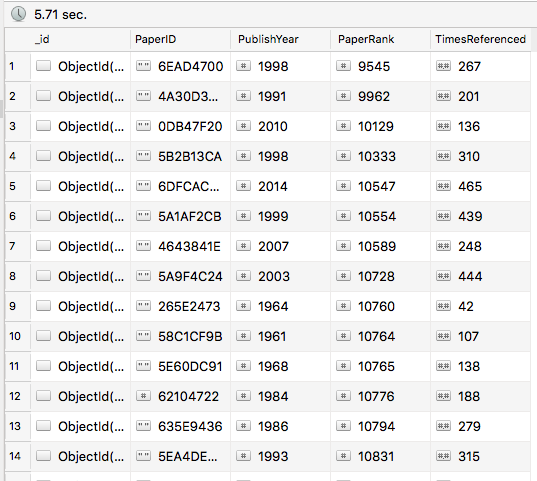 High Ranked Papers
Okay, so my hypothesis holds true, the rank of papers do matter.
In order to take this to the next level, we created a regression model to check out the dependent and independent values, see correlations and find out which attributes of the paper would help us most during recommendation. Even though the initial regression model:
citationcount ~ papercnt + jrnl + confront
rejected the null hypothesis with a small (& controversial) p-value, it did't prove really effective in the later models.
Note: This was all done with mongoDB as database & not graph DB Neo4J.
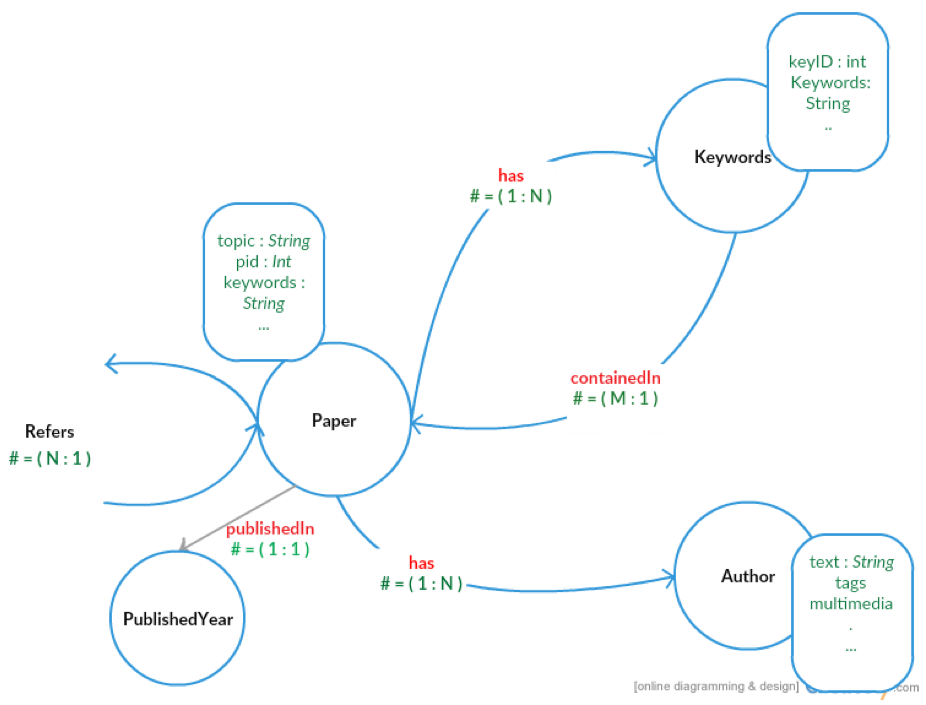
Now that we have enough familiarity with the data, we could go ahead and start our experiments using a graphDB. For our purpose, we used Neo4J, the de-facto GraphDB currently. It has a community edition available (free!!) and lots of help on forums. Neo4J uses it's own query language called - "CYPHER" (cool name for sure). CYPHER is pretty easy to understand, use and has similarity with SQL. Neo4J has a very cool UI wherein you can put in your queries and see the results right on the webpage as interactive graph/table/JSON. The graphs look really neat and organized, but it comes at the cost of clutter and node restrictions, since you can only display (& interpret) certain number of nodes. Although, the number of nodes on the graph is not restricted, but once you go to 100+ nodes it becomes uninterpretable (& super slow). But, this doesn't kill the purpose of GraphDB in anyway, since you can still store million of nodes in the database and do your analysis by looking at nodes, properties and relationships as awesome graphs (yup, they look pretty).
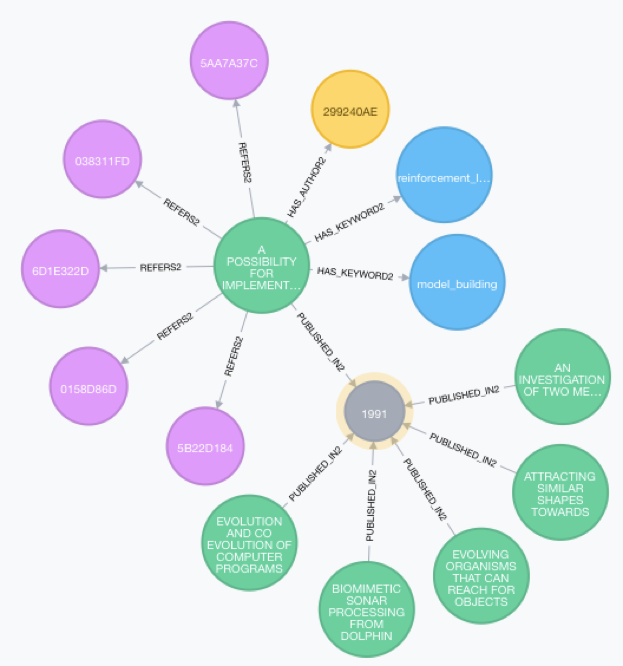
Following is the schema of our graph.
Evaluation:
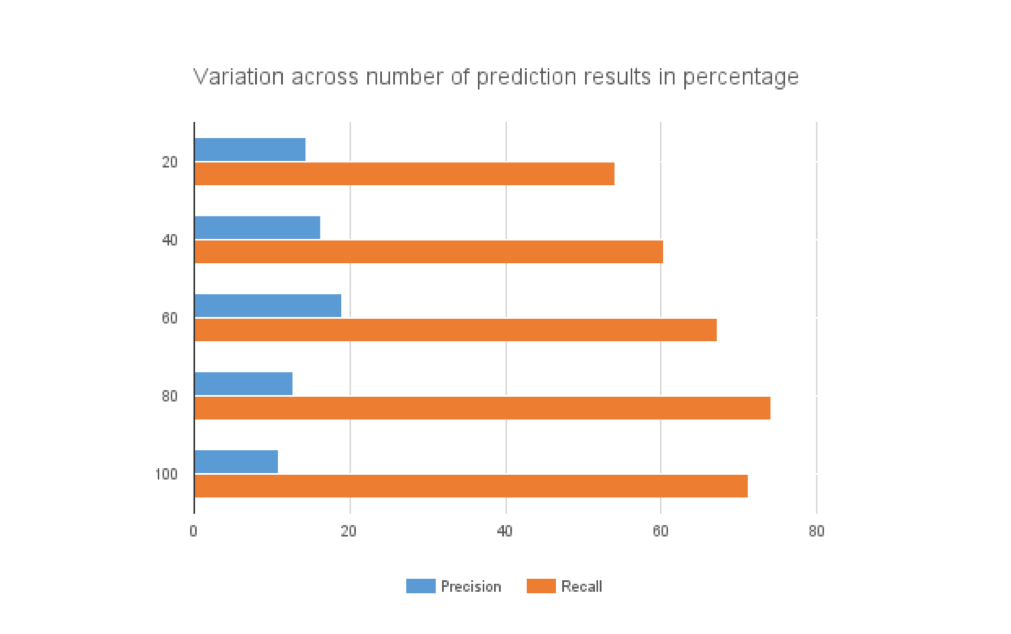
In order to evaluate the performance of our recommendation system, we use Precision and Recall as the metric. For a given paper, we compare the existing citations with the ones recommended by our system. The details could be found in the report.
Precision and recall comparison based on number of papers considered:
Conclusion:
We successfully completed the task of paper citation recommendation. We got the best accuracy of 18% when we varied the number of recommended citations to 60. We believe this result can be improved by considered additional features (especially paper abstract/content for topic modeling) provided in the dataset.
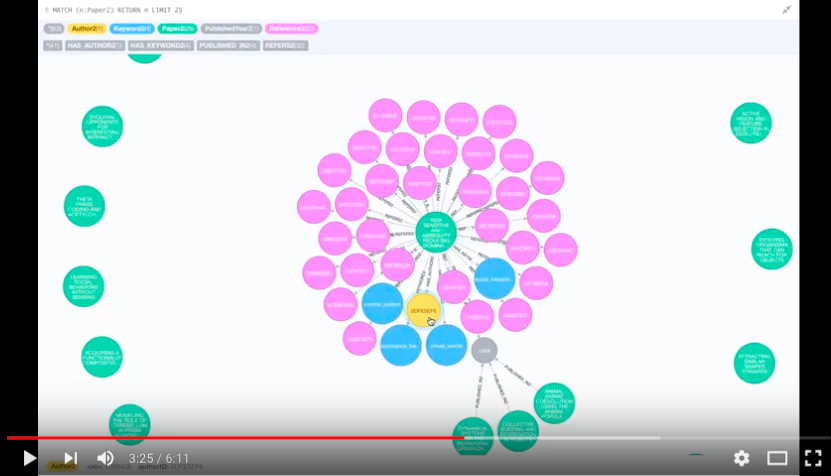
Here's a demo video of the Graph DB:
Also, you can find my report https://drive.google.com/open?id=0ByYLfzcVTeOMeUd1SXlHWEI1elU.